A/B Testing for
Marketing Campaign
Project Phases
1. Data Import and Preparation
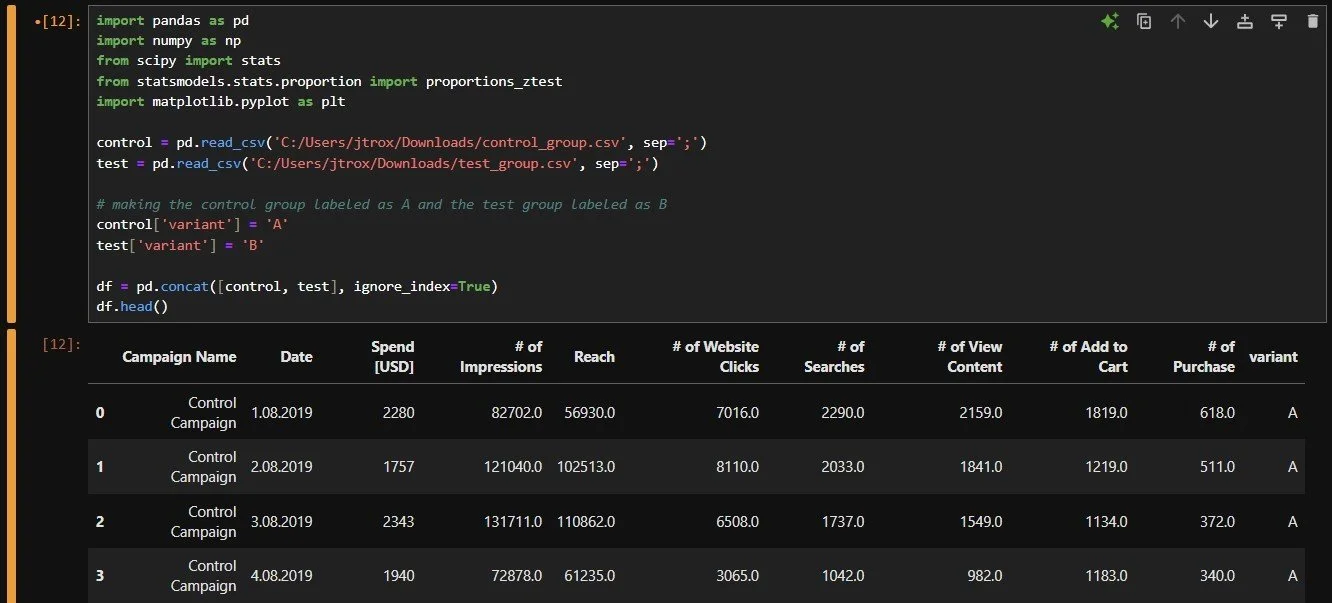
Began by importing Python libraries (pandas, numpy, scipy, statsmodels, and matplotlib).
Then loaded the two CSV files I retrieved from Kaggle. Each file contains performance metrics for two marketing campaigns, a control and test campaign.
Added a new column named “variant” to help distinguish between the control group (A) and the test group (B).
Merged both datasets into a single dataframe and showed the first few rows to verify “variant” column is there.

2. Data Cleaning
Defined key columns to make sure all important metrics are included in cleaning process.
Added a loop to make convert each column into numerical data. This allows for math operations and statistical tests later.
Lastly, showed the structure to ensure the data in key columns are either floats or integers.
3. Data Aggregation and Calculations
Aggregated the data for the key metrics and grouped them into the two different variants (A & B)
Then added two additional performance metrics
Conversion Rate = Total Purchases / Total Clicks
Measures the percentage of clicks that resulted in purchases
Purchases per Dollar = Total Purchases / Total Spend
Evaluates how efficiently each campaign converts spending into sales
Made a summary table that shows Campaign A (control) had a higher conversion rate (9.83%) and better cost efficiency (0.2208 purchases per dollar) compared to Campaign B (test).

4. Statistical Testing for Conversions
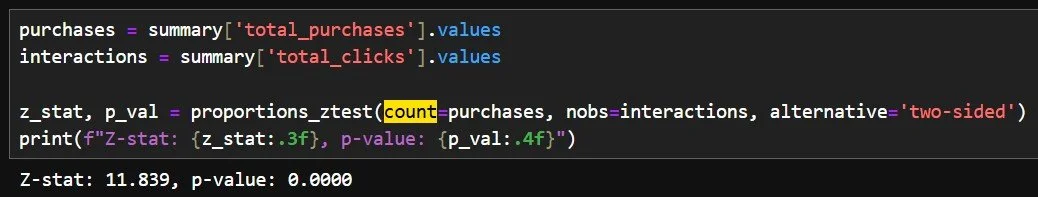
Took the number of purchases and interactions/clicks from the summary table. Ran a two-proportion z-test to compare the purchases (conversion rate) between the two campaigns to see if the observed difference is either random or has a meaningful performance gap.
The Z-stat is high which means there is a large difference between the groups and the p-value is low and below 0.05 which confirms that the difference is statistically significant.
The performance gap between Campaign A and Campaign B is not random. The control campaign outperformed the test version in conversion effectiveness.
5. Cost Efficiency Analysis
Evaluated how efficiently each campaign converts ad spend into customer purchases.
Created a new metric called “purchases per 1000 usd” to show how many purchases each campaign generated for every $1000 spent. This allows for a direct comparison despite a potential difference in campaign budgets.
Campaign A had around 220.8 purchases per $1000 spent, while Campaign B had 203.4 purchases per $1000 spent. Campaign B (test) spent more overall but Campaign A (control) was more cost efficient and had higher purchases per dollar spent.
This reinforces the earlier finding in Step 3 where Campaign A had a higher conversion rate. Campaign A was more cost-effective and achieved higher returns on the same level of expenditure.


6. Data Visualization & Comparison
Created two bar charts to show conversion rate and purchases per dollar spent metrics across both campaigns.
Conversion Rate (Purchases per Click)
This chart shows how effectively each campaign converts website clicks into purchases.
Campaign A demonstrates a higher conversion rate which indicates stronger ad performance and user engagement.
Campaign B shows a noticeable drop which translates into a lower likelihood of converting clicks into sales.
Purchases per Dollar Spent
This chart compares cost efficiency between the campaigns by showing how many purchases were generated per U.S. dollar spent.
Campaign A again outperforms Campaign B and has a higher return on advertising investment.
These bar charts reinforce the findings from earlier stages and shows that Campaign A is both more cost-effective and more conversion-efficient than Campaign B.

7. Absolute and Relative Lift Analysis
Absolute Lift
Shows the difference in conversion rates between Campaign A and Campaign B.
A value of −1.18% tells us that Campaign B’s conversion rate was 1.18 percentage points lower than Campaign A’s.
Relative Lift
Shows the difference as a percentage of Campaign A’s conversion rate.
A value of −12.1% means Campaign B underperformed by approximately 12% compared to Campaign A.
Both the negative absolute and relative lifts confirm that Campaign B did not improve results, performing noticeably worse than Campaign A.
Skills and Tools Used
Used Python for data cleaning, analysis, and visualization.
Managed datasets with pandas for merging, grouping, and calculations.
Applied two-proportion z-tests from statsmodels to compare campaign performance.
Visualized key metrics using matplotlib bar charts.
Calculated conversion rates, cost efficiency, and lift metrics to evaluate results.
Interpreted z-scores and p-values to determine statistical significance.