USGS Live API Flood Monitoring Dashboard
Project Phases
1. Identifying Real-Time Open-Data Sources
Began by researching reliable public data for river monitoring and selected the U.S. Geological Survey as the primary source. The USGS provides live river-gauge readings through a public API that updates throughout the day, making it suitable for real-time monitoring in the Lehigh Valley.
2. Connecting to the Live API
Connected Power BI directly to the USGS Instantaneous-Values API. This required configuring Power BI to retrieve the correct parameters, including station IDs, water-level measurements, and timestamps.
3. Extracting and Structuring Raw JSON Data
The API returns data in nested JSON format, which is not immediately usable.
Using Power Query:
Expanded records
Extracted river location names, coordinates, live water levels, and times
Converted values into the proper numeric and datetime formats
Removed unused fields to keep the model efficient
This process resulted in a clean and refreshable table containing the most recent reading for each monitoring station.
4. Building the Real-Time Dashboard Interface
Built a monitoring dashboard inside Power BI:
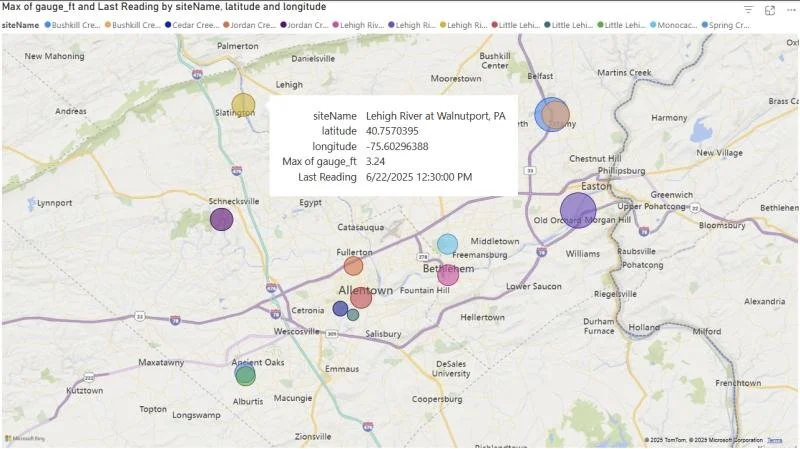
Live Interactive Map
Uses latitude and longitude from each sensor to place points on the map
Bubble size change based on water-height values to show severity visually
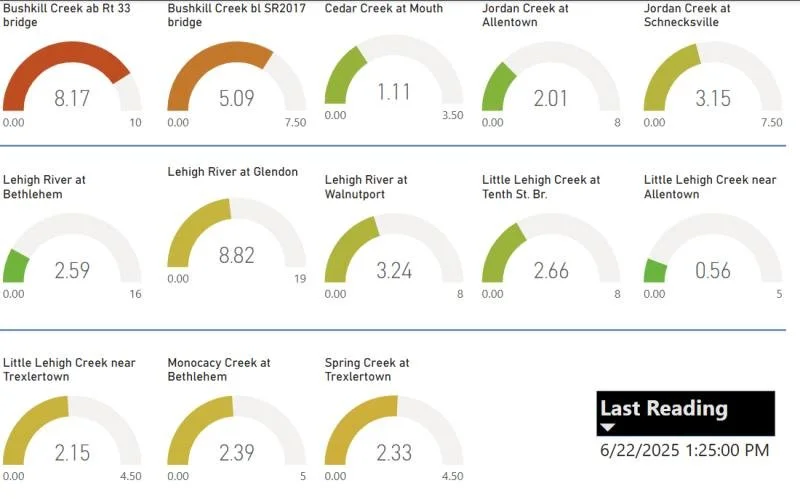
Gauge Visuals for Each Station
Each gauge displays the most recent level for one location
Color and gauge position make it easy to identify rising or concerning levels at a glance
Station-Level Filtering
Each gauge is filtered to one location so the dashboard reads like a live command panel
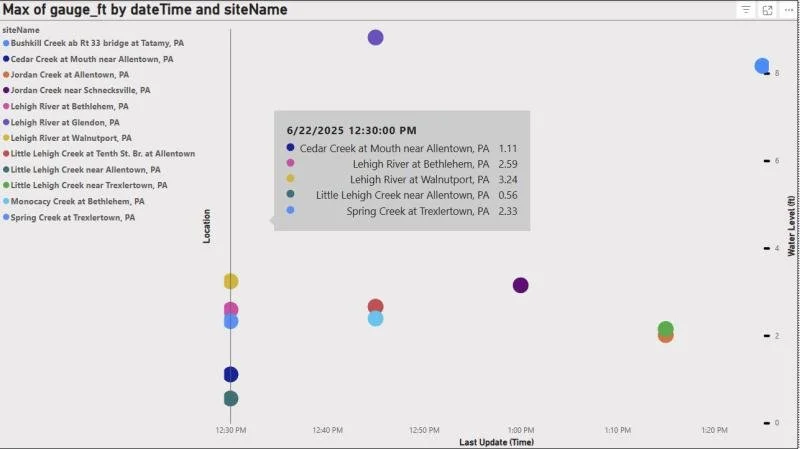
Gauge Update Log
Shows the recency of gauge levels based on the last time water level data was pulled through the API
5. Refresh and Real-Time Monitoring Behavior
Although the dashboard does not currently use automated cloud refresh, it is built so that each time the report is refreshed in Power BI Desktop it retrieves live readings directly from the USGS API.
This makes the dashboard function as a real-time situational awareness tool whenever opened or refreshed.
6. Real-World Value
This dashboard creates a centralized way to monitor water levels across multiple river sites in real time.
It can support flood awareness, safety preparedness, environmental monitoring, and public information efforts by providing a quick, accurate view of river conditions as they change.
Skills and Tools Used
API connection setup and parameter handling
Power Query for JSON parsing and data transformation
Data modeling and cleaning for real-time feeds
Geospatial mapping and visualization with latitude and longitude
Gauge visualization and dashboard layout design
Communication of technical data in a clear monitoring format