Projects
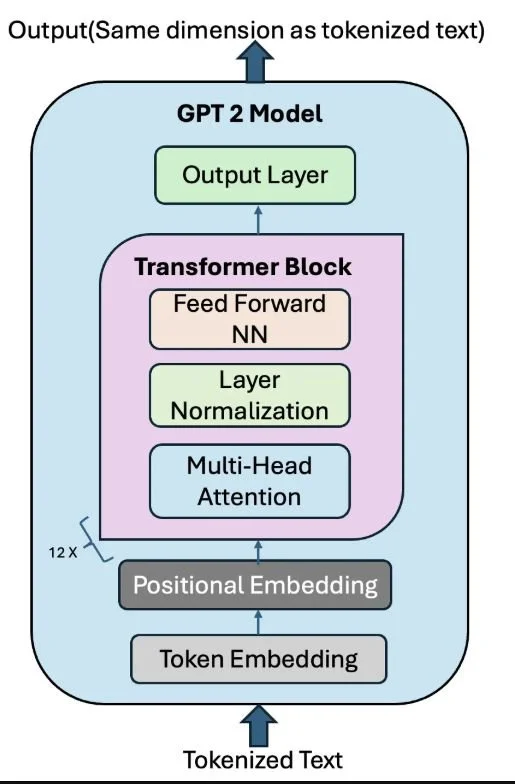
A hands-on deep learning project focused on constructing a GPT-style Large Language Model from the ground up using Python and PyTorch. This project covers the full architecture of a transformer-based language model including tokenization, embedding layers, multi-head self-attention mechanisms, and text generation.
The goal is to develop a foundational understanding of how LLMs work at the code level, rather than relying on pre-built APIs or frameworks. Each component is implemented manually to reinforce the underlying math and logic that powers modern generative AI.
Tools & Concepts: Python, PyTorch, NumPy, Transformer Architecture, Self-Attention, Tokenization, Neural Networks
Building a LLM from Scratch
Raspberry Pi IoT Data Engineering Pipeline
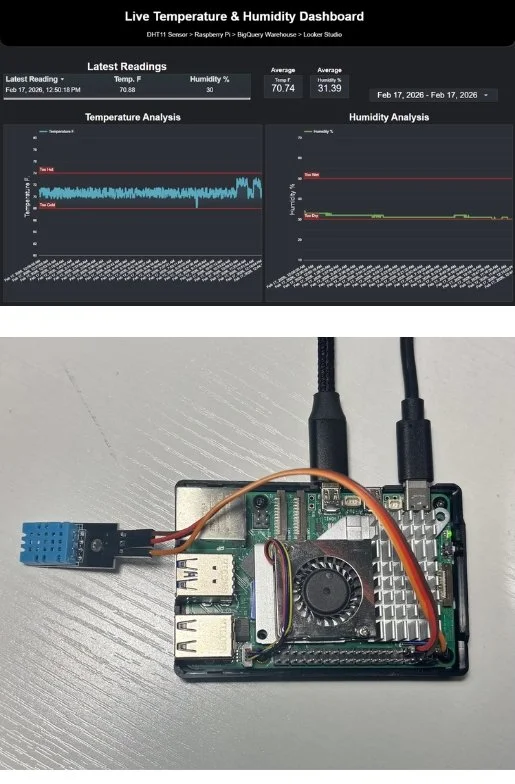
An end-to-end IoT data pipeline that collects and visualizes real-time environmental data using a Raspberry Pi, Google BigQuery, and Looker Studio. A DHT11 sensor reads temperature and humidity levels, while a Python script validates each reading, converts units, and applies standardized timestamps at one-minute intervals. Data is ingested into BigQuery via the streaming insert API, writing one structured row per reading.
Looker Studio connects directly to the BigQuery warehouse to power a live dashboard featuring time-based filtering, trend visualizations, and scorecards displaying the most recent readings. The system reflects real-world IoT monitoring architectures, combining data collection, cloud ingestion, and analytics into a single automated workflow.
Tools & Concepts: Python, Raspberry Pi, DHT11 Sensor, Google BigQuery, Looker Studio, Streaming API, IoT Architecture, Data Validation
Sales & Budgeting Analysis Dashboard (SQL + Power BI)
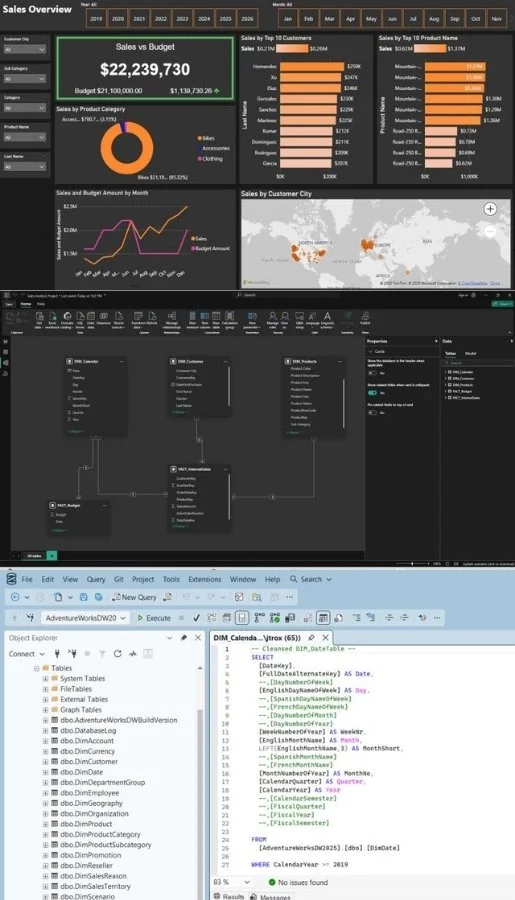
A sales analysis project combining SQL Server and Power BI to support common sales and budgeting business requests. Raw data from Microsoft's AdventureWorks sample databases was imported into SQL Server Management Studio (SSMS), where it was cleaned, transformed, and queried to produce targeted result sets aligned with specific business demands and use cases.
The refined data was exported and connected to Power BI, where table relationships were built and data types configured to support a fully interactive dashboard. The final product features intuitive filters, geographic mapping, KPI scorecards, and chart visuals designed to answer real-world sales and budgeting questions.
Tools & Concepts: Microsoft SQL Server, SSMS, Power BI, Data Modeling, Table Relationships, KPI Scorecards, Geographic Mapping, Business Requirements Analysis
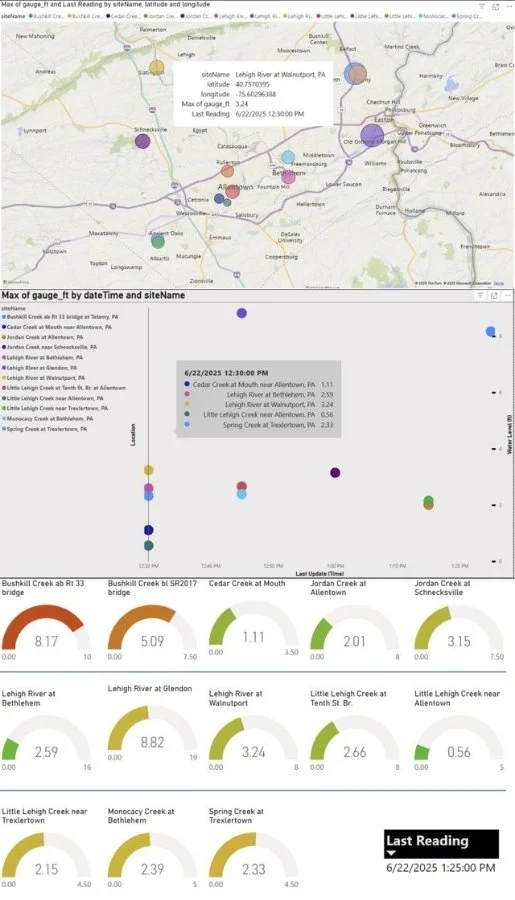
A real-time flood monitoring dashboard built for the Lehigh Valley that transforms raw gauge data from the U.S. Geological Survey into live, decision-ready visuals inside Power BI. The system ingests fresh water-level readings from the USGS Instantaneous-Values REST endpoint using Power Query, then cleans and models the data for interactive consumption. Users can explore rising rivers and streams through geospatial maps, color-coded gauges with threshold logic, and dynamic measures displaying the latest readings.
The dashboard emphasizes data storytelling and UX with a clean layout, accessible color schemes, and tooltips.
Tools & Concepts: Power BI Desktop & Service, Power Query, DAX, USGS REST API, Geospatial Mapping, JSON Ingestion, Data Storytelling